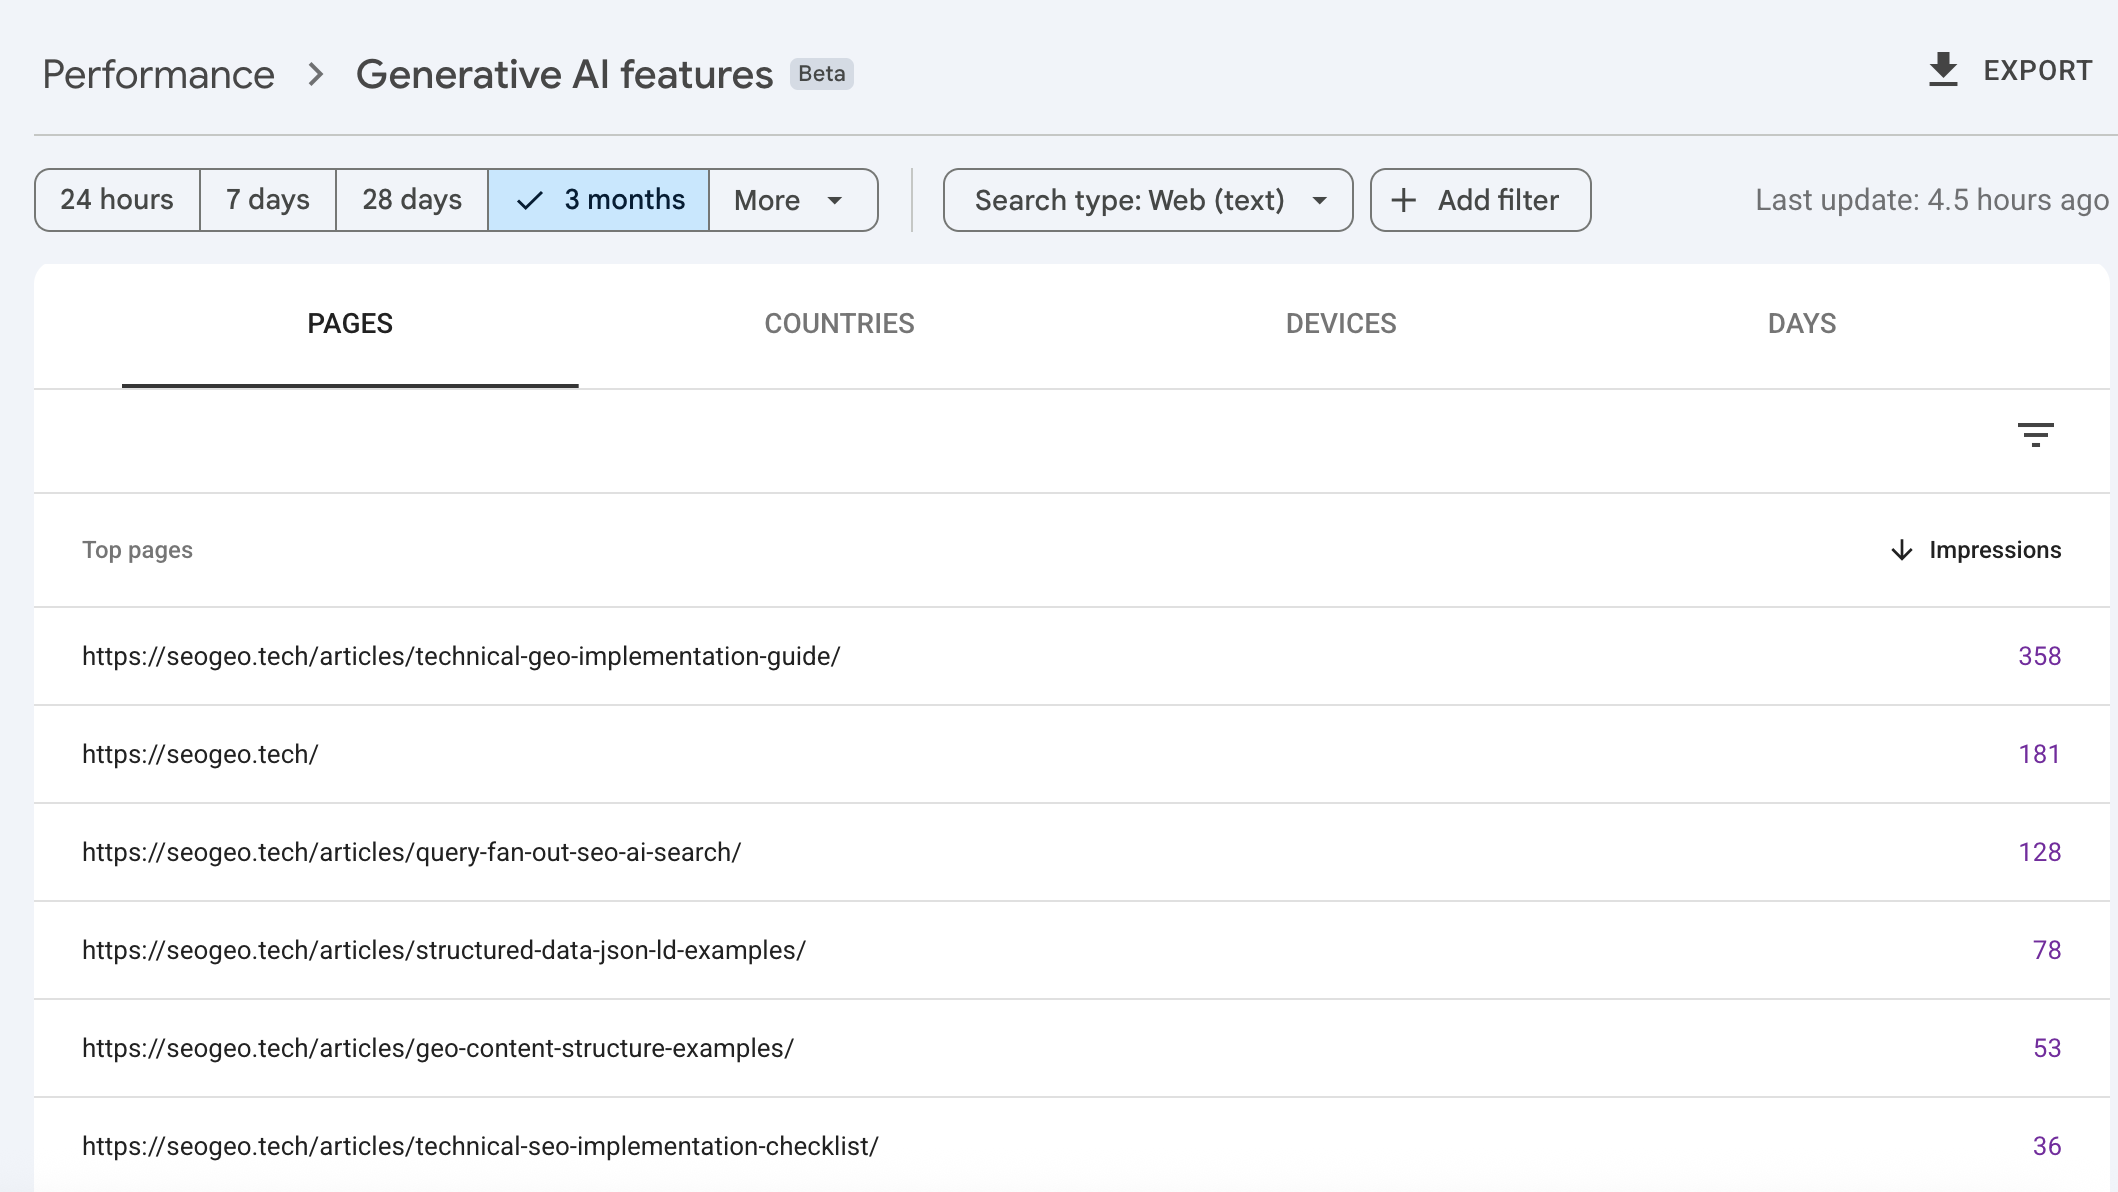

GEO for Visual Evidence and Diagrams shown as a technical dashboard for SEO and GEO implementation work
Use the article as an implementation note: adapt the examples, verify the final HTML, and keep the page updated as the stack changes.

Technical pages often use screenshots, diagrams, dashboards, and small charts as proof. That visual evidence can help a reader trust the page, but it can also create a GEO problem: the most important claim may live inside an image that has no useful surrounding text. If the image fails to load, is cropped in a preview, or is summarized without context, the page loses part of its meaning.

This guide treats visual assets as editorial evidence. The practical goal is simple: a person should understand why the image is there, and a crawler or answer system should be able to connect the image to the same claim without relying on hidden interpretation.

The visual evidence rule

A visual asset should not be the only place where a page makes a technical claim. Use the image to support the explanation, not to carry the explanation alone. For GEO, this matters because answer extraction works better when the claim, supporting details, and caveats are close together.

Think of a screenshot as a witness. It can support the argument, but it should not be the argument.

Use visual evidence when it changes the reader’s decision

Not every article needs images. A decorative dashboard screenshot may make a page look polished, but it does not add much trust if it never answers a reader question. Add a visual only when it helps the reader verify state, compare alternatives, understand a workflow, or avoid a mistake.

Visual typeGood useWeak use
ScreenshotShows a specific setting, output, error, or published page state.Shows a generic admin screen without explaining what changed.
DiagramExplains relationships between entities, URLs, source pages, and generated summaries.Repeats the same list already written in the paragraph.
ChartShows a measured trend with dates, method, and caveats.Shows unlabeled growth with no source or scale.
Code screenshotUseful only when the visual state matters, such as highlighting a UI-generated snippet.Replaces selectable code that should be text.

Pattern: evidence figure with text fallback

The figure below keeps the visual, the claim, and the verification note together. The alt text identifies the image. The caption explains why it matters. The paragraph after the figure gives the fallback meaning in real text.

<figure class="evidence-figure">
  <img
    src="/assets/images/search-console-indexing-example.png"
    alt="Search Console inspection result showing a submitted URL with indexing allowed"
    width="1440"
    height="900"
    loading="lazy">
  <figcaption>
    Search Console inspection result for one published article URL. The screenshot supports
    the indexing check, but the page should still state the URL, date checked, and limitation
    in text.
  </figcaption>
</figure>

<p>
  Checked on 2026-06-22: the article URL returned 200, had an indexable robots directive,
  and used a self-referencing canonical URL. This does not guarantee ranking or immediate
  inclusion in search results.
</p>

Alt text is not a place for the whole article

Alt text should describe the image in context. It should not become a hidden paragraph stuffed with every keyword on the page. For charts and complex diagrams, put the important data or logic elsewhere on the page, then use alt text to identify the visual.

Too vague

alt="GEO diagram"

Too much

alt="GEO diagram about AI search visibility, answer engines, citations, entity relationships, schema, llms.txt, content structure, search rankings, and SEO optimization"

Better

alt="Diagram showing a source article, supporting pages, and an AI answer summary connected by internal links"

Decision notes for different visual assets

The right text treatment depends on the job of the image. A screenshot, chart, flow diagram, and decorative illustration should not receive the same alt text or caption pattern.

AssetAlt textNearby textGEO risk to avoid
Dashboard screenshotDescribe the screen and the visible state.State the checked date, source, URL scope, and caveat.Making unverifiable performance claims from a cropped image.
Workflow diagramName the relationship shown.Write the steps as HTML text below or beside the diagram.Putting the process only inside labels in an image.
Comparison chartIdentify the chart and variables.Provide the values or conclusion in text.Publishing a chart with no method or scale.
Decorative illustrationUse empty alt text when it adds no meaning.No extra explanation needed.Forcing decorative images to carry keywords.

Write diagram data as text once

If a diagram contains the only copy of the process, it is fragile. Keep the diagram for scanning, but write the same logic once as text. This does not need to be long. A short ordered list below the diagram is often enough.

<figure class="content-image">
  <img src="/assets/images/geo-retrieval-path.png"
       alt="Diagram of a GEO retrieval path from source page to supporting examples"
       width="1440"
       height="900"
       loading="lazy">
  <figcaption>A retrieval path works best when the source page, examples, and caveats are linked visibly.</figcaption>
</figure>

<ol>
  <li>Publish one source page that defines the topic and scope.</li>
  <li>Link supporting examples back to that source page.</li>
  <li>Keep caveats close to the recommendation they qualify.</li>
  <li>Use captions and surrounding text to explain what each visual proves.</li>
</ol>

Evidence inventory for a technical article

Before adding visuals to a GEO article, make a small inventory. This keeps the page from collecting impressive-looking but unhelpful screenshots.

Article: GEO for Visual Evidence and Diagrams
Visual: search-console-indexing-example.png
Purpose: show what a live indexing check records
Claim supported: the inspected URL is technically indexable
Text fallback: status, canonical, robots, checked date, limitation
Redactions: remove private query data and account identifiers
Do not claim: ranking improvement, guaranteed indexing, AI citation visibility

Visual: geo-retrieval-path.png
Purpose: explain how a source page connects to examples and caveats
Claim supported: relationship clarity helps readers and summarizers
Text fallback: ordered list of the same path

Image filenames and preferred image signals

Use stable, descriptive filenames for meaningful images. A filename such as geo-visual-evidence-diagram.png is easier to maintain than image-7-final-new.png. For a page’s main image, keep the Open Graph image, Article schema image, and visible image aligned when possible. Do not use a generic logo as every article image if the page has a more representative visual.

For responsive images, keep an img element with a real src fallback. A visual that only exists as a CSS background can be missed or misunderstood in contexts where the image itself needs to be discovered.

When screenshots need redaction

Screenshots from analytics tools, search consoles, CMS dashboards, or AI answer tests can be useful, but they often include private information. Redact account names, tokens, email addresses, unpublished URLs, exact revenue, client data, and query lists that should not be public. After redaction, say what was redacted if it affects interpretation.

Screenshot sourceSafe to showUsually redact
Search ConsoleURL inspection state, coverage category, date checked.Private query lists, account email, unrelated properties.
CMS adminPublic page title, slug, publishing state.User names, tokens, internal drafts, private comments.
AI answer testingPrompt type, date, observed citation or absence.Personal accounts, private workspace names, unpublished prompts.
Analytics dashboardTrend shape when method is explained.Revenue, client names, exact private traffic data.

A lighter schema note

Most pages do not need special visual schema. Use the normal article or webpage schema already appropriate for the page, and make sure the image field points to a representative image. If a visual asset is the main subject of a page, ImageObject can describe the image itself, but it should not replace visible context, captions, or source notes.

{
  "@context": "https://schema.org",
  "@type": "Article",
  "headline": "GEO for Visual Evidence and Diagrams",
  "image": "https://example.com/assets/images/geo-visual-evidence-diagram.png",
  "datePublished": "2026-06-22",
  "dateModified": "2026-06-22",
  "author": {
    "@type": "Organization",
    "name": "Example Editorial Team"
  }
}

Before publishing, read the page without images

This is the fastest check. Temporarily hide images or read the page in a text-only view. If the article still explains the claim, method, limitation, and next step, the visuals are supporting evidence. If the page becomes confusing, move the missing meaning into HTML text.

  • The main claim is present in text, not only in an image.
  • Each meaningful image has alt text that fits its purpose.
  • Complex diagrams have a nearby text version of the logic.
  • Charts include labels, date range, method, and a written conclusion.
  • Screenshots are redacted and do not expose private data.
  • The page’s representative image is relevant, high quality, and not just the site logo.

References

Use these guides when visual evidence should support Technical GEO without becoming decorative.